|
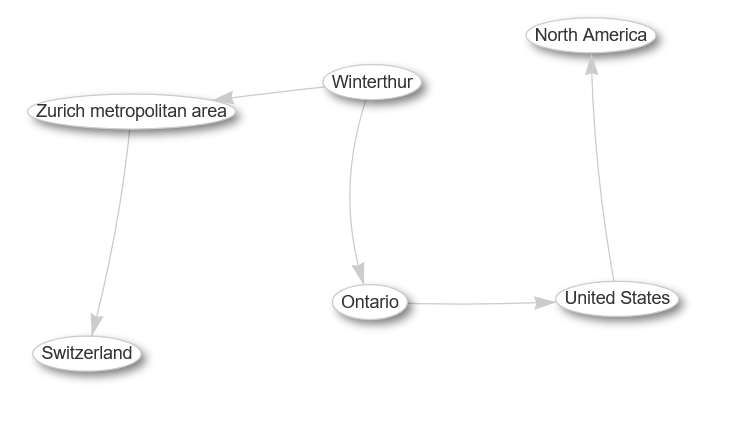
Once you execute the query in Wikidata, in the results pane, it is
possible to select different methods to display the output. The
default method is a table. By clicking on the pulldown menu, you can
change the default method to a graph. As you do that you will see the
graphical version of the data as shown below.
Figure 1: Visualization of the query results using Wikidata graph tool
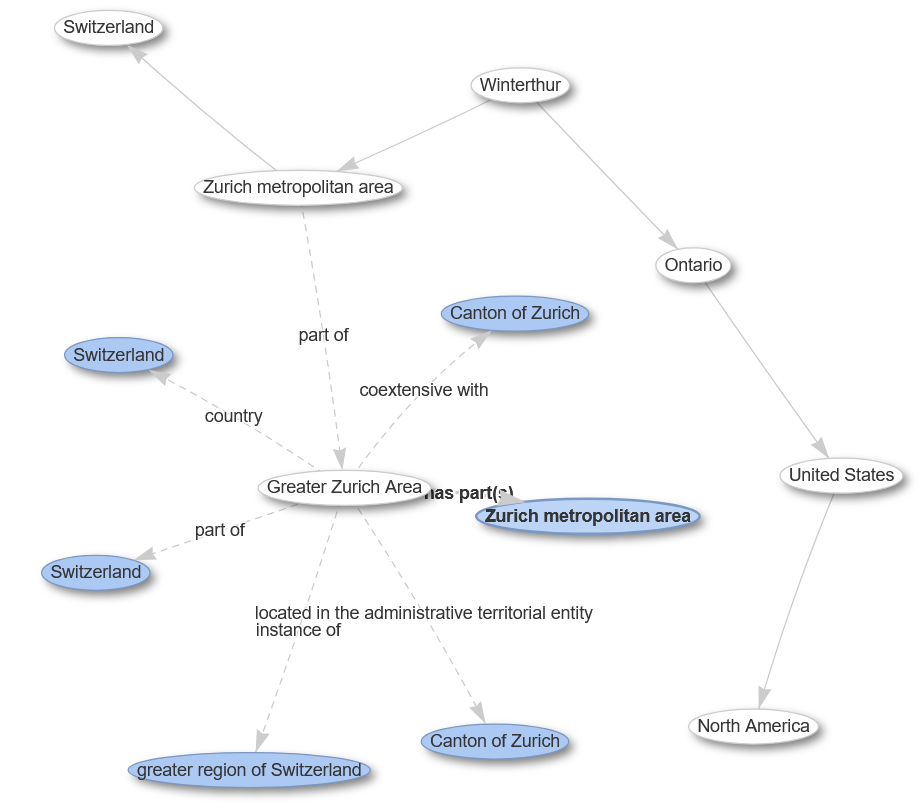
Even though the initial visualization does not reveal edge labels,
but if you double click on a node, you can see all the nodes connected
to it and their labels as shown below.
Figure 2: Nodes in the visualization can be clicked to reveal other connected nodes and the edge labels.
|